The solution
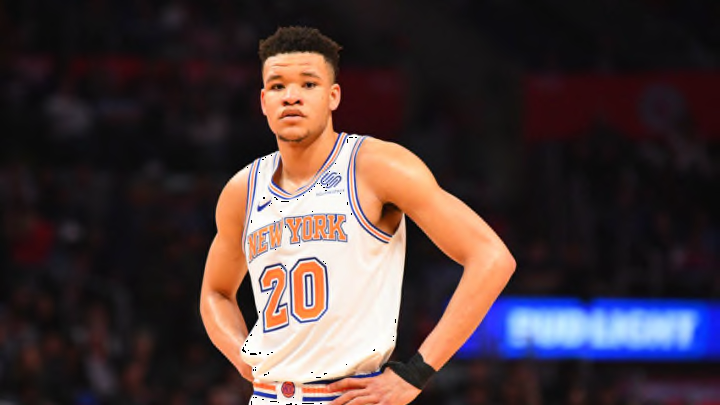
As we all know, history repeats itself and Knox is not the first player, nor will he be the last, to experience a slow start to their career. But to help Knox develop and become that contributor the Knicks need, he has to get more playing time to gain experience and learn from his mistakes.
A player that comes to mind when thinking of someone who got extended playing time while struggling is Brandon Ingram.
More from Hoops Habit
- 7 Players the Miami Heat might replace Herro with by the trade deadline
- Meet Cooper Flagg: The best American prospect since LeBron James
- Are the Miami Heat laying the groundwork for their next super team?
- Sophomore Jump: 5 second-year NBA players bound to breakout
- NBA Trades: The Lakers bolster their frontcourt in this deal with the Pacers
Now I chose to compare Knox to Ingram not because they are both small forwards with lanky 6’9″ frames, can run the floor, and have nice shooting mechanics. But they were also lottery picks with high expectations attached to them.
Before Ingram was drafted, there were a lot of comparisons between him and Kevin Durant based on their length and ability to score. Ingram’s first three seasons with the Los Angeles Lakers were concerning because he was not developing a complete well-rounded game that was expected from him. As written by Quentin Haynes, some of the lacking aspects of Ingram’s well-rounded game were his defense and jump shot.
These concerns the Lakers’ front office and fans had about Ingram are the same concerns that the New York Knicks’ front office and fans currently have about Knox.
But in Ingram’s fourth year (granted he is on the New Orleans Pelicans), he has made forward progress (no pun intended) on the concerns everyone had about him. Now he is proving why he was meant to be a 2019-20 NBA All-Star and why he was the second overall pick in the 2016 NBA Draft.
| Season | Age | Tm | G | GS | MP | FG% | 3P% | FT% | TRB | AST | STL | BLK | PF | PTS |
|---|---|---|---|---|---|---|---|---|---|---|---|---|---|---|
| 2016-17 | 19 | LAL | 79 | 40 | 28.8 | .402 | .294 | .621 | 4.0 | 2.1 | 0.6 | 0.5 | 2.0 | 9.4 |
| 2017-18 | 20 | LAL | 59 | 59 | 33.5 | .470 | .390 | .681 | 5.3 | 3.9 | 0.8 | 0.7 | 2.8 | 16.1 |
| 2018-19 | 21 | LAL | 52 | 52 | 33.8 | .497 | .330 | .675 | 5.1 | 3.0 | 0.5 | 0.6 | 2.9 | 18.3 |
| 2019-20 | 22 | NOP | 48 | 48 | 33.9 | .475 | .405 | .857 | 6.3 | 4.3 | 0.9 | 0.7 | 2.9 | 24.7 |
| Career | 238 | 199 | 32.1 | .463 | .362 | .715 | 5.0 | 3.2 | 0.7 | 0.6 | 2.6 | 16.1 | ||
| 3 seasons | LAL | 190 | 151 | 31.7 | .458 | .329 | .662 | 4.7 | 2.9 | 0.6 | 0.6 | 2.5 | 13.9 | |
| 1 season | NOP | 48 | 48 | 33.9 | .475 | .405 | .857 | 6.3 | 4.3 | 0.9 | 0.7 | 2.9 | 24.7 |
Provided by Basketball-Reference.com: View Original Table
Generated 2/23/2020.
Reviewing Ingram’s and Knox’s rookie numbers, it is apparent they are somewhat similar. However, their sophomore seasons are drastically different.
One reason for the difference in their sophomore seasons is that Ingram’s playing time increased, unlike Knox’s. The increase in playing time allowed Ingram to develop his game and learn from his mistakes. Unfortunately for Knox, he “pays for his transgressions” by getting the bench when his performance starts to slip revoking his chance to learn from his mistakes during the game (I had to add a Clyde Fraizer-ism).
The second reason is in the usage rate for both players to develop their rhythm. Per Cleaning the Glass, Ingram’s usage rate between years one to two increased from 17.3 percent to 23 percent. Knox’s usage rate decreased from 20.9 percent to 17.1 percent.
The drop in usage can affect a player’s game because basketball is a game that involves finding a rhythm. If certain players are not given enough opportunities to touch the ball and score, it can cause a player to be out of sync and lose the feel of the game. And for a developing player like Knox that has experienced a drastic change in minutes and usage, it explains why Knox has been struggling this season.
